生成堆积面积图的步骤
要在 JavaFX 中生成堆积面积图,请按照以下步骤操作。
第 1 步:创建一个类
创建一个Java类并继承 Application 包的类别 javafx.application. 然后你可以实现start() 这个类的方法如下。
public class ClassName extends Application {
   @Override
   public void start(Stage primaryStage) throws Exception {
   }
}
步骤 2:定义轴
定义堆积面积图的 X 和 Y 轴并为其设置标签。在我们的示例中,X 轴代表从 1750 年到 2050
年的不同年份。它们具有每 50 年的主要刻度单位。而 Y 轴代表以百万计的人口增长。
//Defining the X axis
CategoryAxis xAxis = new CategoryAxis();
xAxis.setCategories(FXCollections.<String>observableArrayList
   (Arrays.asList("1 750", "1800", "1850", "1900", "1950", "1999", "2050" )));
//Defining the Y axis
NumberAxis yAxis = new NumberAxis(0, 10000, 2500);
yAxis.setLabel("Population in Billions");
第 3 步:创建堆积面积图
通过实例化名为的类来创建折线图 StackedAreaChart 包裹的 javafx.scene.chart. 向该类的构造函数传递上一步创建的表示 X
轴和 Y 轴的对象。
//Creating the Area chart
StackedAreaChart<String, Number> areaChart = new StackedAreaChart(xAxis, yAxis);
areaChart.setTitle("Historic and Estimated Worldwide Population Growth by Region");
第 4 步:准备数据
实例化 XYChart.Series 类并将数据(一系列 x 和 y
坐标)添加到此类的 Observable 列表中,如下所示 -
//Prepare XYChart.Series objects by setting data
XYChart.Series series1 = new XYChart.Series();
series1.setName("Asia");
series1.getData().add(new XYChart.Data("1750", 502));
series1.getData().add(new XYChart.Data("1800", 635));
series1.getData().add(new XYChart.Data("1850", 809));
series1.getData().add(new XYChart.Data("1900", 947));
series1.getData().add(new XYChart.Data("1950", 1402));
series1.getData().add(new XYChart.Data("1999", 3634));
series1.getData().add(new XYChart.Data("2050", 5268));
XYChart.Series series2 = new XYChart.Series();
series2.setName("Africa");
series2.getData().add(new XYChart.Data("1750", 106));
series2.getData().add(new XYChart.Data("1800", 107));
series2.getData().add(new XYChart.Data("1850", 111));
series2.getData().add(new XYChart.Data("1900", 133));
series2.getData().add(new XYChart.Data("1950", 221));
series2.getData().add(new XYChart.Data("1999", 767));
series2.getData().add(new XYChart.Data("2050", 1766));
XYChart.Series series3 = new XYChart.Series();
series3.setName("Europe");
series3.getData().add(new XYChart.Data("1750", 163));
series3.getData().add(new XYChart.Data("1800", 203));
series3.getData().add(new XYChart.Data("1850", 276));
series3.getData().add(new XYChart.Data("1900", 408));
series3.getData().add(new XYChart.Data("1950", 547));
series3.getData().add(new XYChart.Data("1999", 729));
series3.getData().add(new XYChart.Data("2050", 628));
XYChart.Series series4 = new XYChart.Series();
series4.setName("America");
series4.getData().add(new XYChart.Data("1750", 18));
series4.getData().add(new XYChart.Data("1800", 31));
series4.getData().add(new XYChart.Data("1850", 54));
series4.getData().add(new XYChart.Data("1900", 156));
series4.getData().add(new XYChart.Data("1950", 339));
series4.getData().add(new XYChart.Data("1999", 818));
series4.getData().add(new XYChart.Data("2050", 1201));
XYChart.Series series5 = new XYChart.Series();
series5.setName("Oceania");
series5.getData().add(new XYChart.Data("1750", 2));
series5.getData().add(new XYChart.Data("1800", 2));
series5.getData().add(new XYChart.Data("1850", 2));
series5.getData().add(new XYChart.Data("1900", 6));
series5.getData().add(new XYChart.Data("1950", 13));
series5.getData().add(new XYChart.Data("1999", 30));
series5.getData().add(new XYChart.Data("2050", 46));
步骤 5:将数据添加到堆积面积图
将上一步中准备的数据系列添加到堆积面积图中,如下所示 -
//Setting the data to area chart
areaChart.getData().addAll(series1, series2, series3, series4, series5);
步骤 6:创建组对象
在里面 start() 方法,通过实例化名为的类创建一个组对象 Group,属于包 javafx.scene.
将上一步创建的 StackedAreaChart(节点)对象作为参数传递给 Group
类的构造函数。这样做是为了将其添加到组中,如下所示 -
Group root = new Group(stackedAreaChart);
步骤 7:创建场景对象
通过实例化名为的类来创建场景 Scene,属于包 javafx.scene. 向这个类传递 Group 对象 (root) 在上一步中创建。
除了根对象,你还可以传递两个表示屏幕高度和宽度的双参数,以及 Group 类的对象,如下所示。
Scene scene = new Scene(group ,600, 300);
第八步:设置舞台标题
您可以使用 setTitle() 的方法 Stage班级。这primaryStage
是一个Stage对象,作为参数传递给场景类的start方法。
使用 primaryStage 对象,将场景的标题设置为 Sample Application 如下。
primaryStage.setTitle("Sample Application");
第 9 步:将场景添加到舞台
您可以使用方法将 Scene 对象添加到舞台 setScene() 类名为 Stage. 使用此方法添加前面步骤中准备的 Scene 对象,如下所示。
primaryStage.setScene(scene);
第 10 步:显示舞台内容
使用名为的方法显示场景的内容 show() 的 Stage 类如下。
第 11 步:启动应用程序
通过调用静态方法启动 JavaFX 应用程序 launch() 的 Application 类从主要方法如下。
public static void main(String args[]){
   launch(args);
}
例子
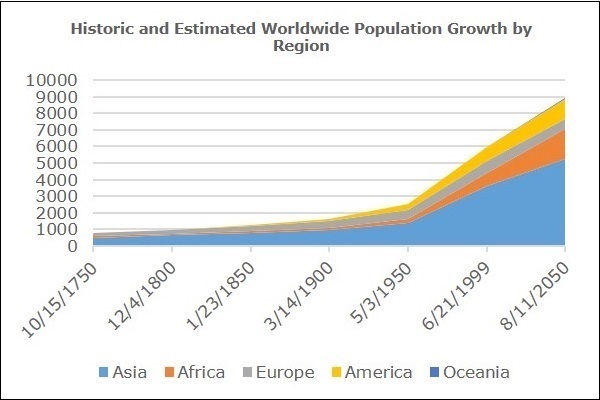
下表列出了从 1750 年到 2050 年不同大陆的人口。
|
亚洲 |
非洲 |
欧洲 |
美国 |
大洋洲 |
| 1750 |
502 |
106 |
163 |
18 |
2 |
| 1800 |
635 |
107 |
203 |
31 |
2 |
| 1850 |
809 |
111 |
276 |
54 |
2 |
| 1900 |
947 |
133 |
408 |
156 |
6 |
| 1950 |
1402 |
221 |
547 |
339 |
13 |
| 1999 |
3634 |
767 |
729 |
818 |
30 |
| 2050 |
5268 |
1766 |
628 |
1201 |
46 |
以下是一个 Java 程序,它使用 JavaFX 生成描述上述数据的堆积面积图。
将此代码保存在名称为的文件中 StackedAreaChartExample.java.
import java.util.Arrays;
import javafx.application.Application;
import static javafx.application.Application.launch;
import javafx.collections.FXCollections;
import javafx.scene.Group;
import javafx.scene.Scene;
import javafx.scene.chart.CategoryAxis;
import javafx.stage.Stage;
import javafx.scene.chart.NumberAxis;
import javafx.scene.chart.StackedAreaChart;
import javafx.scene.chart.XYChart;

public class StackedAreaChartExample extends Application {
   @Override
   public void start(Stage stage) {
      //Defining the axes
      CategoryAxis xAxis = new CategoryAxis();
      xAxis.setCategories(FXCollections.<String>observableArrayList(
      Arrays.asList("1750", "1800", "1850", "1900", "1950", "1999", "2050" )));

      NumberAxis yAxis = new NumberAxis(0, 10000, 2500);
      yAxis.setLabel("Population in Millions");

      //Creating the Area chart
      StackedAreaChart<String, Number> areaChart = new StackedAreaChart(xAxis, yAxis);
      areaChart.setTitle("Historic and Estimated Worldwide Population Growth by Region");

      //Prepare XYChart.Series objects by setting data
      XYChart.Series series1 = new XYChart.Series();

      series1.setName("Asia");
      series1.getData().add(new XYChart.Data("1750", 502));
      series1.getData().add(new XYChart.Data("1800", 635));
      series1.getData().add(new XYChart.Data("1850", 809));
      series1.getData().add(new XYChart.Data("1900", 947));
      series1.getData().add(new XYChart.Data("1950", 1402));
      series1.getData().add(new XYChart.Data("1999", 3634));
      series1.getData().add(new XYChart.Data("2050", 5268));

      XYChart.Series series2 = new XYChart.Series();
      series2.setName("Africa");
      series2.getData().add(new XYChart.Data("1750", 106));
      series2.getData().add(new XYChart.Data("1800", 107));
      series2.getData().add(new XYChart.Data("1850", 111));
      series2.getData().add(new XYChart.Data("1900", 133));
      series2.getData().add(new XYChart.Data("1950", 221));
      series2.getData().add(new XYChart.Data("1999", 767));
      series2.getData().add(new XYChart.Data("2050", 1766));

      XYChart.Series series3 = new XYChart.Series();
      series3.setName("Europe");

      series3.getData().add(new XYChart.Data("1750", 163));
      series3.getData().add(new XYChart.Data("1800", 203));
      series3.getData().add(new XYChart.Data("1850", 276));
      series3.getData().add(new XYChart.Data("1900", 408));
      series3.getData().add(new XYChart.Data("1950", 547));
      series3.getData().add(new XYChart.Data("1999", 729));
      series3.getData().add(new XYChart.Data("2050", 628));

      XYChart.Series series4 = new XYChart.Series();
      series4.setName("America");
      series4.getData().add(new XYChart.Data("1750", 18));
      series4.getData().add(new XYChart.Data("1800", 31));
      series4.getData().add(new XYChart.Data("1850", 54));
      series4.getData().add(new XYChart.Data("1900", 156));
      series4.getData().add(new XYChart.Data("1950", 339));
      series4.getData().add(new XYChart.Data("1999", 818));
      series4.getData().add(new XYChart.Data("2050", 1201));

      XYChart.Series series5 = new XYChart.Series();
      series5.setName("Oceania");
      series5.getData().add(new XYChart.Data("1750", 2));
      series5.getData().add(new XYChart.Data("1800", 2));
      series5.getData().add(new XYChart.Data("1850", 2));
      series5.getData().add(new XYChart.Data("1900", 6));
      series5.getData().add(new XYChart.Data("1950", 13));
      series5.getData().add(new XYChart.Data("1999", 30));
      series5.getData().add(new XYChart.Data("2050", 46));

      //Setting the data to area chart
      areaChart.getData().addAll(series1, series2, series3, series4, series5);

      //Creating a Group object
      Group root = new Group(areaChart);

      //Creating a scene object
      Scene scene = new Scene(root, 600, 400);

      //Setting title to the Stage
      stage.setTitle("Stacked Area Chart");

      //Adding scene to the stage
      stage.setScene(scene);

      //Displaying the contents of the stage
      stage.show();
   }
   public static void main(String args[]){
      launch(args);
   }
}
使用以下命令从命令提示符编译并执行保存的 java 文件。
javac StackedAreaChartExample.java
java StackedAreaChartExample
执行时,上述程序会生成一个 JavaFX 窗口,显示如下所示的堆积面积图。
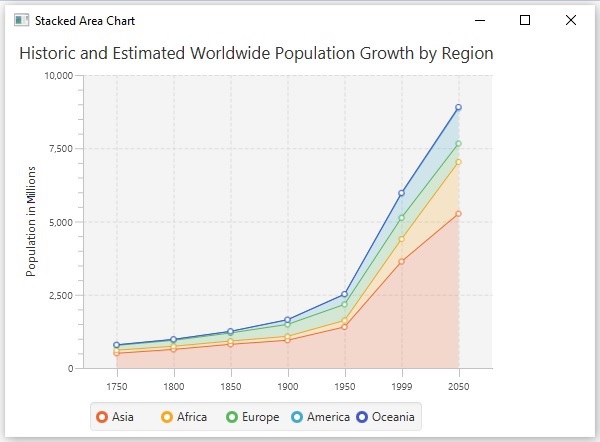
 在 JavaFX 中,堆积面积图由名为的类表示 StackedAreaChart. 这个类属于包javafx.scene.chart. 通过实例化此类,您可以在 JavaFX 中创建 StackedAreaChart 节点。